INVESTMENT MANAGEMENTEmpire Life Investment Team |
WHY INVEST IN THIS FUNDYou are seeking growth by investing primarily in global equity securities |
FUND FACTS| Asset Class | Portfolio Funds |
|---|
| Size (Mill) | $14.42 |
|---|
| MER | 3.48 % |
|---|
| Inception | May 28, 2018 |
|---|
| Total Holdings | 202 |
|---|
|
RISK TOLERANCE | | | | | | | | | |
|---|
| low | low to medium | medium | medium to high | high |
|
ASSET MIX| U.S. Equities | 46.6 % |
|---|
| International Equities | 39.2 % |
|---|
| Canadian Equities | 9.6 % |
|---|
| Cash and Cash Equivalents | 4.6 % |
|---|
SECTOR MIX| Financials | 21.9 % |
|---|
| Information technology | 17.0 % |
|---|
| Industrials | 13.7 % |
|---|
| Consumer discretionary | 11.9 % |
|---|
| Health care | 11.1 % |
|---|
| Energy | 8.1 % |
|---|
| Consumer staples | 5.4 % |
|---|
| Materials | 3.9 % |
|---|
| Communication services | 3.5 % |
|---|
| Utilities | 2.1 % |
|---|
| Real Estate | 1.3 % |
|---|
|
GROWTH OF $10,000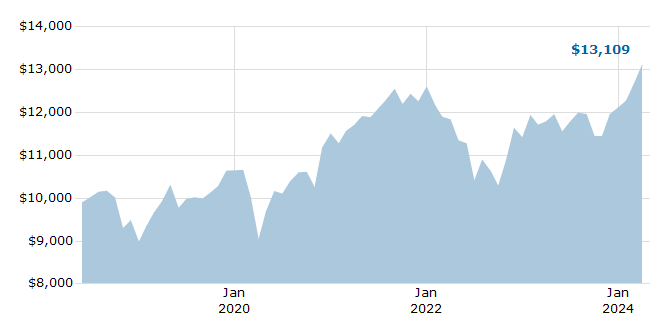
For Illustration Purposes Only
|
TOP 10 HOLDINGS| ROYAL BK OF CAD 4.95% 01APR24 TD | 4.4 % |
|---|
| Microsoft Corporation | 3.1 % |
|---|
| Visa Inc. 'A' | 2.0 % |
|---|
| MasterCard Inc. 'A' | 1.9 % |
|---|
| Amazon.com Inc | 1.6 % |
|---|
| Novo Nordisk AS, Series 'B'. | 1.5 % |
|---|
| Anthem Inc. | 1.5 % |
|---|
| SAP SE | 1.4 % |
|---|
| PNC Financial Services Group Inc. (The) Com | 1.4 % |
|---|
| Merck & Company Inc. | 1.3 % |
|---|
| Total of Top 10 | 20.2 % |
|---|
|
COMPOUND ANNUAL RETURNS| 1 mo | 3 mo | YTD | 1 yr | 3 yr | 5 yr | 10 yr | Inception |
|---|
| 3.49 | 8.19 | 8.19 | 11.22 | 3.84 | 5.71 | | 4.74 |
CALENDAR YEAR RETURNS| 2016 | 2017 | 2018 | 2019 | 2020 | 2021 | 2022 | 2023 |
|---|
| | | | 18.70 | 8.05 | 9.49 | -9.38 | 6.18 |
|
 EMPIRE LIFE EMBLEM GLOBAL AGGRESSIVE PORTFOLIO GIF