INVESTMENT MANAGEMENTEmpire Life Investment Team |
WHY INVEST IN THIS FUNDYou are seeking growth and income by investing primarily in equity and fixed income investment funds, with a target equity allocation of 80% |
FUND FACTS| Asset Class | Canadian Balanced |
|---|
| Size (Mill) | $594.15 |
|---|
| MER (2020) | 1.36 % |
|---|
| Inception | October 23, 2017 |
|---|
| Total Holdings | 553 |
|---|
|
RISK TOLERANCE | | | | | | | | | |
|---|
| low | low to medium | medium | medium to high | high |
|
ASSET MIX| Canadian Equities | 36.8 % |
|---|
| Canadian Bonds | 27.8 % |
|---|
| U.S. Equities | 19.1 % |
|---|
| International Equities | 7.2 % |
|---|
| Cash and Cash Equivalents | 6.0 % |
|---|
| U.S. Bonds | 2.2 % |
|---|
| Mutual Fund | 1.0 % |
|---|
| International Bonds | 0.1 % |
|---|
UNDERLYING FUNDS| Canadian Equity Funds | weight |
|---|
| Empire Life Elite Equity Fund | 68.7 % |
|---|
| Bond Funds | |
|---|
| Empire Life Bond Fund | 30.3 % |
|---|
|
GROWTH OF $10,000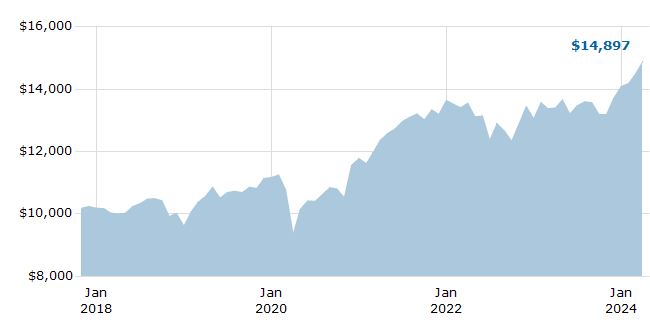
For Illustration Purposes Only
|
TOP 10 HOLDINGS| ROYAL BK OF CAD 2.65% 01MAY25 TD | 4.1 % |
|---|
| Royal Bank of Canada | 2.3 % |
|---|
| Agnico Eagle Mines Limited | 1.5 % |
|---|
| Microsoft Corporation | 1.5 % |
|---|
| Enbridge Inc. | 1.4 % |
|---|
| Toronto-Dominion Bank | 1.4 % |
|---|
| Canadian Pacific Railway Limited | 1.2 % |
|---|
| Cameco Corp. | 1.2 % |
|---|
| ROYAL BK OF CAD 4.3% 01MAY25 $USD TD | 1.2 % |
|---|
| WSP Global Inc. | 1.0 % |
|---|
| Total of Top 10 | 17.0 % |
|---|
|
COMPOUND ANNUAL RETURNS| 1 mo | 3 mo | YTD | 1 yr | 3 yr | 5 yr | 10 yr | Inception |
|---|
| -1.47 | -4.43 | -1.95 | 8.14 | 6.36 | 9.22 | | 6.26 |
CALENDAR YEAR RETURNS| 2017 | 2018 | 2019 | 2020 | 2021 | 2022 | 2023 | 2024 |
|---|
| | -5.59 | 16.21 | 5.43 | 15.83 | -4.31 | 7.90 | 14.26 |
|
 EMPIRE LIFE ELITE BALANCED FUND