INVESTMENT MANAGEMENTAshley Misquitta, CFA
David Mann, CFA
Empire Life Investment Team |
WHY INVEST IN THIS FUNDYou are seeking growth by investing primarily in dividend paying global equity securities |
FUND FACTS| Asset Class | Global Equity |
|---|
| Size (Mill) | $149.43 |
|---|
| MER (2020) | 2.63 % |
|---|
| Inception | May 7, 2007 |
|---|
| Total Holdings | 71 |
|---|
|
RISK TOLERANCE | | | | | | | | | |
|---|
| low | low to medium | medium | medium to high | high |
|
ASSET MIX| U.S. Equities | 52.4 % |
|---|
| International Equities | 28.1 % |
|---|
| Canadian Equities | 10.6 % |
|---|
| Cash and Cash Equivalents | 8.9 % |
|---|
SECTOR MIX| Financials | 23.1 % |
|---|
| Health care | 16.7 % |
|---|
| Energy | 11.9 % |
|---|
| Consumer discretionary | 11.8 % |
|---|
| Information technology | 11.0 % |
|---|
| Industrials | 9.5 % |
|---|
| Consumer staples | 7.4 % |
|---|
| Communication services | 4.3 % |
|---|
| Utilities | 2.2 % |
|---|
| Materials | 2.1 % |
|---|
|
GROWTH OF $10,000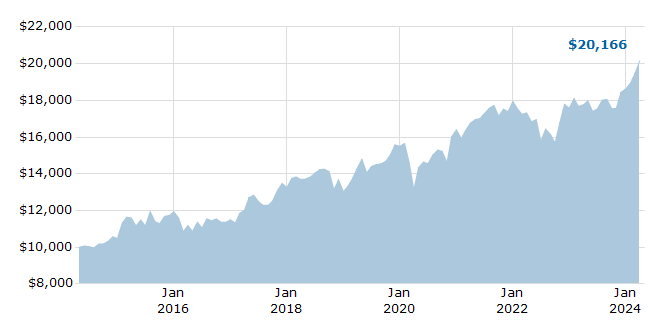
For Illustration Purposes Only
|
TOP 10 HOLDINGS| ROYAL BK OF CAD 4.95% 01APR24 TD | 8.8 % |
|---|
| Microsoft Corporation | 3.4 % |
|---|
| Cintas Corporation | 3.2 % |
|---|
| Canadian Natural Resources Limited | 2.8 % |
|---|
| Pan Pacific International Holdings Corporation | 2.7 % |
|---|
| Ross Stores Inc. | 2.6 % |
|---|
| PNC Financial Services Group Inc. (The) Com | 2.5 % |
|---|
| Novo Nordisk AS, Series 'B'. | 2.5 % |
|---|
| UnitedHealth Group Inc. | 2.5 % |
|---|
| Visa Inc. 'A' | 2.2 % |
|---|
| Total of Top 10 | 33.2 % |
|---|
|
COMPOUND ANNUAL RETURNS| 1 mo | 3 mo | YTD | 1 yr | 3 yr | 5 yr | 10 yr | Inception |
|---|
| 3.50 | 8.20 | 8.20 | 13.53 | 6.34 | 7.08 | 7.27 | 2.83 |
CALENDAR YEAR RETURNS| 2016 | 2017 | 2018 | 2019 | 2020 | 2021 | 2022 | 2023 |
|---|
| -3.70 | 15.29 | -1.73 | 18.94 | 5.85 | 9.41 | -2.05 | 5.98 |
|
 EMPIRE LIFE GLOBAL DIVIDEND GROWTH FUND