INVESTMENT MANAGEMENTDoug Cooper, CFA
Empire Life Investment Team |
WHY INVEST IN THIS FUNDYou are seeking growth by investing primarily in dividend paying Canadian equity securities |
FUND FACTS| Asset Class | Canadian Equity |
|---|
| Size (Mill) | $569.01 |
|---|
| MER | 3.11 % |
|---|
| Inception | November 3, 2014 |
|---|
| Total Holdings | 67 |
|---|
|
RISK TOLERANCE | | | | | | | | | |
|---|
| low | low to medium | medium | medium to high | high |
|
ASSET MIX| Canadian Equities | 82.4 % |
|---|
| U.S. Equities | 8.2 % |
|---|
| International Equities | 7.7 % |
|---|
| Cash and Cash Equivalents | 1.7 % |
|---|
SECTOR MIX| Financials | 29.3 % |
|---|
| Energy | 12.9 % |
|---|
| Industrials | 10.7 % |
|---|
| Materials | 9.1 % |
|---|
| Communication services | 8.3 % |
|---|
| Consumer staples | 7.6 % |
|---|
| Consumer discretionary | 6.1 % |
|---|
| Utilities | 6.0 % |
|---|
| Information technology | 4.5 % |
|---|
| Real Estate | 3.3 % |
|---|
| Health care | 2.3 % |
|---|
|
GROWTH OF $10,000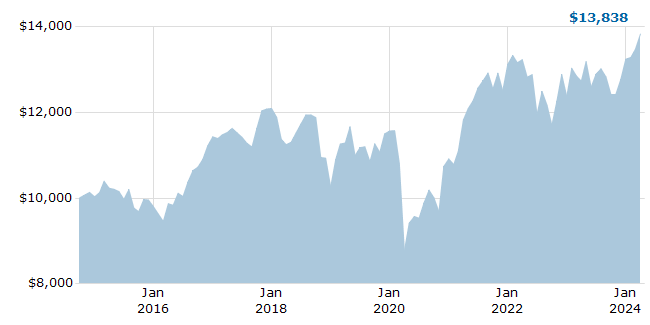
For Illustration Purposes Only
|
TOP 10 HOLDINGS| Royal Bank of Canada | 5.7 % |
|---|
| Toronto-Dominion Bank | 5.6 % |
|---|
| TELUS Corporation | 3.1 % |
|---|
| Bank of Montreal | 2.7 % |
|---|
| Sun Life Financial Inc. | 2.6 % |
|---|
| Canadian Natural Resources Limited | 2.6 % |
|---|
| Alimentation Couche-Tard Inc. Com | 2.5 % |
|---|
| Suncor Energy Inc. | 2.5 % |
|---|
| Canadian Pacific Railway Limited | 2.5 % |
|---|
| Enbridge Inc. | 2.4 % |
|---|
| Total of Top 10 | 32.2 % |
|---|
|
COMPOUND ANNUAL RETURNS| 1 mo | 3 mo | YTD | 1 yr | 3 yr | 5 yr | 10 yr | Inception |
|---|
| -0.86 | -3.54 | -1.20 | 9.56 | 4.82 | 9.42 | 3.76 | 3.79 |
CALENDAR YEAR RETURNS| 2017 | 2018 | 2019 | 2020 | 2021 | 2022 | 2023 | 2024 |
|---|
| 5.79 | -15.15 | 12.75 | -5.63 | 20.21 | -5.71 | 7.01 | 12.89 |
|
 EMPIRE LIFE DIVIDEND GROWTH GIF