INVESTMENT MANAGEMENTEmpire Life Investment Team |
WHY INVEST IN THIS FUNDYou are seeking growth and income by investing primarily in equity and fixed income investment funds, with a target equity allocation of 80% |
FUND FACTS| Asset Class | Canadian Balanced |
|---|
| Size (Mill) | $508.40 |
|---|
| MER | 3.04 % |
|---|
| Inception | November 3, 2014 |
|---|
| Total Holdings | 370 |
|---|
|
RISK TOLERANCE | | | | | | | | | |
|---|
| low | low to medium | medium | medium to high | high |
|
ASSET MIX| Canadian Equities | 65.6 % |
|---|
| Canadian Bonds | 18.0 % |
|---|
| U.S. Equities | 7.3 % |
|---|
| International Equities | 5.9 % |
|---|
| Cash and Cash Equivalents | 1.6 % |
|---|
| U.S. Bonds | 1.6 % |
|---|
| International Bonds | 0.1 % |
|---|
UNDERLYING FUNDS| Canadian Equity Funds | weight |
|---|
| Empire Life Dividend Growth Fund | 79.4 % |
|---|
| Bond Funds | |
|---|
| Empire Life Bond Fund | 19.8 % |
|---|
|
GROWTH OF $10,000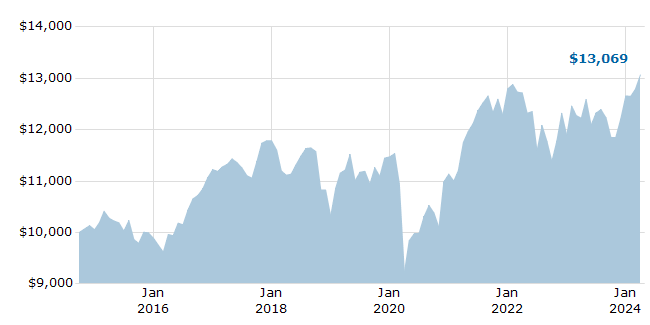
For Illustration Purposes Only
|
TOP 10 HOLDINGS| Royal Bank of Canada | 4.8 % |
|---|
| Toronto-Dominion Bank | 4.2 % |
|---|
| Bank of Montreal | 2.9 % |
|---|
| TC Energy Corporation | 2.8 % |
|---|
| Enbridge Inc. | 2.4 % |
|---|
| Bank of Nova Scotia | 2.2 % |
|---|
| Rogers Communications Inc. 'B' | 2.1 % |
|---|
| Canadian Natural Resources Limited | 2.1 % |
|---|
| Brookfield Asset Management Inc. 'A' | 2.1 % |
|---|
| TELUS Corporation | 1.9 % |
|---|
| Total of Top 10 | 27.4 % |
|---|
|
COMPOUND ANNUAL RETURNS| 1 mo | 3 mo | YTD | 1 yr | 3 yr | 5 yr | 10 yr | Inception |
|---|
| 2.14 | 3.25 | 3.25 | 6.90 | 3.59 | 3.10 | | 2.88 |
CALENDAR YEAR RETURNS| 2016 | 2017 | 2018 | 2019 | 2020 | 2021 | 2022 | 2023 |
|---|
| 13.49 | 4.98 | -12.41 | 11.17 | -2.93 | 14.91 | -7.07 | 6.41 |
|
 EMPIRE LIFE DIVIDEND BALANCED GIF