INVESTMENT MANAGEMENTAshley Misquitta, CFA
David Mann, CFA
Empire Life Investment Team |
WHY INVEST IN THIS FUNDYou are seeking growth by investing primarily in global large cap equity securities |
FUND FACTS| Asset Class | Global Equity |
|---|
| Size (Mill) | $180.37 |
|---|
| MER (2020) | 2.67 % |
|---|
| Inception | February 1, 1989 |
|---|
| Total Holdings | 122 |
|---|
|
RISK TOLERANCE | | | | | | | | | |
|---|
| low | low to medium | medium | medium to high | high |
|
ASSET MIX| U.S. Equities | 55.0 % |
|---|
| International Equities | 35.2 % |
|---|
| Cash and Cash Equivalents | 7.5 % |
|---|
| Canadian Equities | 2.3 % |
|---|
SECTOR MIX| Financials | 20.5 % |
|---|
| Information technology | 18.7 % |
|---|
| Health care | 12.7 % |
|---|
| Consumer discretionary | 12.6 % |
|---|
| Industrials | 11.5 % |
|---|
| Energy | 7.5 % |
|---|
| Consumer staples | 5.9 % |
|---|
| Communication services | 4.5 % |
|---|
| Materials | 3.1 % |
|---|
| Utilities | 2.1 % |
|---|
| Real Estate | 1.0 % |
|---|
|
GROWTH OF $10,000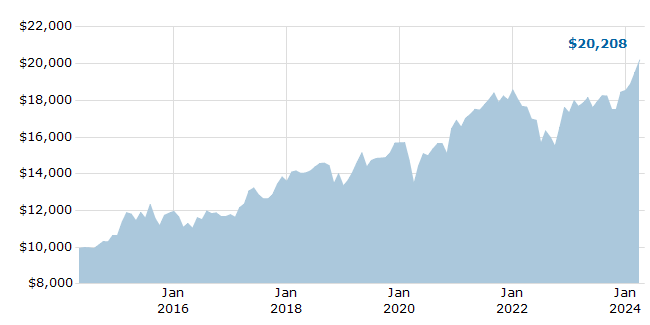
For Illustration Purposes Only
|
TOP 10 HOLDINGS| Microsoft Corporation | 4.6 % |
|---|
| ROYAL BK OF CAD 4.95% 01APR24 TD | 4.1 % |
|---|
| Anthem Inc. | 2.2 % |
|---|
| Amazon.com Inc | 2.1 % |
|---|
| MasterCard Inc. 'A' | 2.0 % |
|---|
| Merck & Company Inc. | 1.9 % |
|---|
| PNC Financial Services Group Inc. (The) Com | 1.9 % |
|---|
| Fiserv Inc. | 1.7 % |
|---|
| Visa Inc. 'A' | 1.7 % |
|---|
| Ross Stores Inc. | 1.6 % |
|---|
| Total of Top 10 | 23.8 % |
|---|
|
COMPOUND ANNUAL RETURNS| 1 mo | 3 mo | YTD | 1 yr | 3 yr | 5 yr | 10 yr | Inception |
|---|
| 3.44 | 8.91 | 8.91 | 13.10 | 5.41 | 6.64 | 7.29 | 5.04 |
CALENDAR YEAR RETURNS| 2016 | 2017 | 2018 | 2019 | 2020 | 2021 | 2022 | 2023 |
|---|
| -1.56 | 15.45 | -1.85 | 17.56 | 7.84 | 9.76 | -6.66 | 7.02 |
|
 EMPIRE LIFE GLOBAL EQUITY FUND