COMPOSITION DE L'ACTIF| Obligations canadiennes | 61,1 % |
|---|
| Actions canadiennes | 21,7 % |
|---|
| Actions américaines | 8,1 % |
|---|
| Actions internationales | 5,5 % |
|---|
| Trésorerie et équivalents de trésorerie | 2,8 % |
|---|
| Obligations américaines | 0,7 % |
|---|
TYPE D'OBLIGATIONS| Investment Grade Corporate | 46,8 % |
|---|
| Provincial Government | 25,4 % |
|---|
| Federal Government | 24,3 % |
|---|
| Floating Rate | 2,7 % |
|---|
| Municipal Government | 0,8 % |
|---|
|
CROISSANCE DE 10 000 $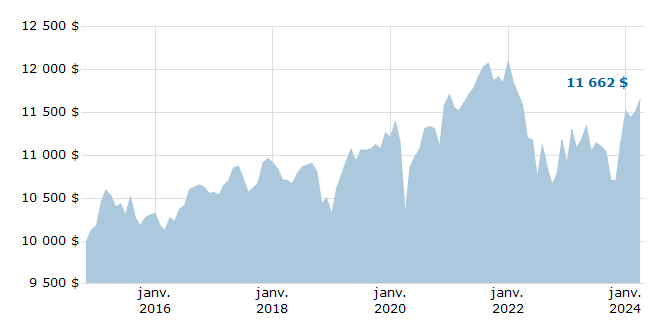
À des fins d’illustration seulement
|
DIX PRINCIPAUX TITRES| ROYAL BK OF CAD 4.95% 01APR24 TD | 2,3 % |
|---|
| Gouv. du Canada, 2,5 %, 2032-12-01 | 2,1 % |
|---|
| Gouvernement du Canada 2,000 % 1er décembre 2051 | 1,8 % |
|---|
| Banque Royale du Canada | 1,6 % |
|---|
| La Banque Toronto-Dominion | 1,2 % |
|---|
| Gouvernement du Canada 2,250 % 1er juin 2029 | 1,2 % |
|---|
| Province de l’Ontario, 3,65 %, 2033-06-02 | 1,2 % |
|---|
| Inter Pipeline Ltd., 4,23 %, 2027-06-01 | 1,1 % |
|---|
| Gouv. du Canada, 2 %, 2032-06-01 | 1,1 % |
|---|
| Fid. Can pour l’hab. No 1, 1,6 %, 2031-12-15 | 1,0 % |
|---|
| Total des dix principaux titres | 14,6 % |
|---|
|
RENDEMENTS ANNUELS COMPOSÉS| 1 mois | 3 mois | CA | 1 an | 3 ans | 5 ans | 10 ans | Création |
|---|
| 1,32 | 1,22 | 1,22 | 4,27 | 0,13 | 1,30 | | 1,65 |
RENDEMENTS PAR ANNÉE CIVILE| 2016 | 2017 | 2018 | 2019 | 2020 | 2021 | 2022 | 2023 |
|---|
| 2,35 | 3,30 | -5,48 | 8,73 | 4,40 | 3,33 | -9,88 | 5,66 |
|
 EMPIRE VIE FPG PORTEFEUILLE CONSERVATEUR EMBLÈME