INVESTMENT MANAGEMENTDavid Mann, CFA
Empire Life Investment Team |
WHY INVEST IN THIS FUNDYou are seeking growth by investing primarily in international large cap equity securities |
FUND FACTS| Asset Class | Global Equity |
|---|
| Size (Mill) | $97.23 |
|---|
| MER (2020) | 3.03 % |
|---|
| Inception | June 23, 2003 |
|---|
| Total Holdings | 61 |
|---|
|
RISK TOLERANCE | | | | | | | | | |
|---|
| low | low to medium | medium | medium to high | high |
|
ASSET MIX| International Equities | 91.7 % |
|---|
| Cash and Cash Equivalents | 3.8 % |
|---|
| U.S. Equities | 2.9 % |
|---|
| Canadian Equities | 1.6 % |
|---|
SECTOR MIX| Financials | 23.8 % |
|---|
| Industrials | 17.9 % |
|---|
| Information technology | 16.7 % |
|---|
| Consumer discretionary | 15.3 % |
|---|
| Health care | 10.6 % |
|---|
| Consumer staples | 5.9 % |
|---|
| Materials | 3.3 % |
|---|
| Energy | 2.6 % |
|---|
| Real Estate | 2.5 % |
|---|
| Communication services | 1.6 % |
|---|
|
GROWTH OF $10,000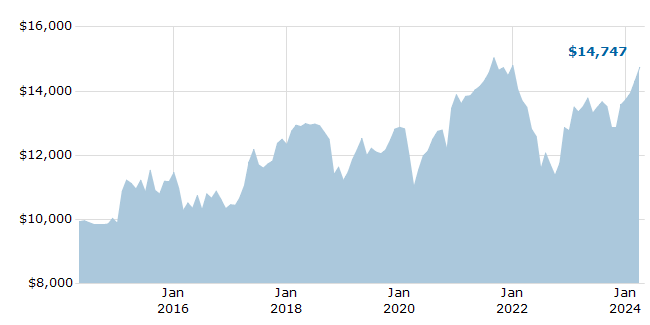
For Illustration Purposes Only
|
TOP 10 HOLDINGS| SAP SE | 3.6 % |
|---|
| ROYAL BK OF CAD 4.95% 01APR24 TD | 3.5 % |
|---|
| Pan Pacific International Holdings Corporation | 3.2 % |
|---|
| Novo Nordisk AS, Series 'B'. | 3.1 % |
|---|
| Air Liquide SA | 3.1 % |
|---|
| Aon PLC | 3.1 % |
|---|
| ASML Holding NV | 3.0 % |
|---|
| Hannover Rueck SE | 3.0 % |
|---|
| Compass Group PLC | 2.8 % |
|---|
| Melrose Industries PLC Ord Gbp0.22857142 | 2.6 % |
|---|
| Total of Top 10 | 31.0 % |
|---|
|
COMPOUND ANNUAL RETURNS| 1 mo | 3 mo | YTD | 1 yr | 3 yr | 5 yr | 10 yr | Inception |
|---|
| 2.94 | 7.29 | 7.29 | 8.96 | 2.08 | 3.88 | 3.96 | 2.31 |
CALENDAR YEAR RETURNS| 2016 | 2017 | 2018 | 2019 | 2020 | 2021 | 2022 | 2023 |
|---|
| -8.70 | 17.88 | -9.06 | 14.77 | 7.87 | 6.55 | -13.72 | 7.60 |
|
 EMPIRE LIFE INTERNATIONAL EQUITY FUND