INVESTMENT MANAGEMENTEmpire Life Investment Team |
WHY INVEST IN THIS FUNDYou are seeking growth by investing primarily in Canadian large cap equity securities |
FUND FACTS| Asset Class | Canadian Equity |
|---|
| Size (Mill) | $1.39 |
|---|
| MER | 2.35 % |
|---|
| Inception | January 29, 1971 |
|---|
| Total Holdings | 209 |
|---|
|
RISK TOLERANCE | | | | | | | | | |
|---|
| low | low to medium | medium | medium to high | high |
|
ASSET MIX| Canadian Equities | 50.0 % |
|---|
| U.S. Equities | 27.8 % |
|---|
| International Equities | 10.4 % |
|---|
| Cash and Cash Equivalents | 10.4 % |
|---|
| Mutual Fund | 1.4 % |
|---|
SECTOR MIX| Financials | 23.1 % |
|---|
| Information technology | 15.0 % |
|---|
| Industrials | 13.4 % |
|---|
| Energy | 11.8 % |
|---|
| Materials | 8.3 % |
|---|
| Consumer staples | 6.2 % |
|---|
| Utilities | 6.0 % |
|---|
| Consumer discretionary | 5.6 % |
|---|
| Communication services | 4.5 % |
|---|
| Health care | 4.1 % |
|---|
| Real Estate | 1.9 % |
|---|
|
GROWTH OF $10,000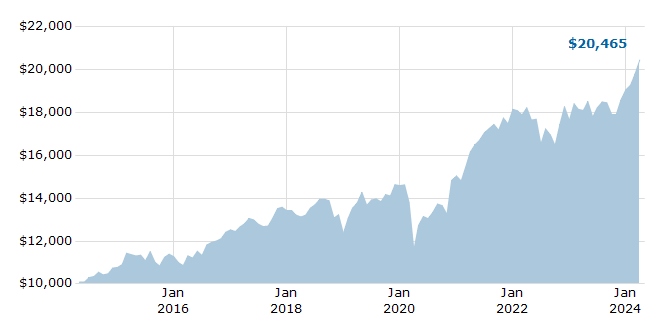
For Illustration Purposes Only
|
TOP 10 HOLDINGS| Royal Bank of Canada | 3.1 % |
|---|
| Microsoft Corporation | 2.2 % |
|---|
| Agnico Eagle Mines Limited | 2.2 % |
|---|
| Toronto-Dominion Bank | 1.9 % |
|---|
| Enbridge Inc. | 1.9 % |
|---|
| Cameco Corp. | 1.7 % |
|---|
| ROYAL BK OF CAD 4.3% 01MAY25 $USD TD | 1.7 % |
|---|
| Canadian Pacific Railway Limited | 1.7 % |
|---|
| Constellation Software Inc. | 1.4 % |
|---|
| WSP Global Inc. | 1.4 % |
|---|
| Total of Top 10 | 19.4 % |
|---|
|
COMPOUND ANNUAL RETURNS| 1 mo | 3 mo | YTD | 1 yr | 3 yr | 5 yr | 10 yr | Inception |
|---|
| -1.73 | -6.09 | -3.12 | 7.85 | 7.02 | 11.18 | 6.71 | 10.30 |
CALENDAR YEAR RETURNS| 2017 | 2018 | 2019 | 2020 | 2021 | 2022 | 2023 | 2024 |
|---|
| 7.15 | -7.91 | 18.06 | 3.11 | 20.66 | -2.85 | 8.07 | 17.16 |
|
 EMPIRE LIFE EQUITY GROWTH FUND #3